Every number on your report is built from these two lists, and every row in them is built from photos you can look at. This is where you check the work.
Empty Bunk Events
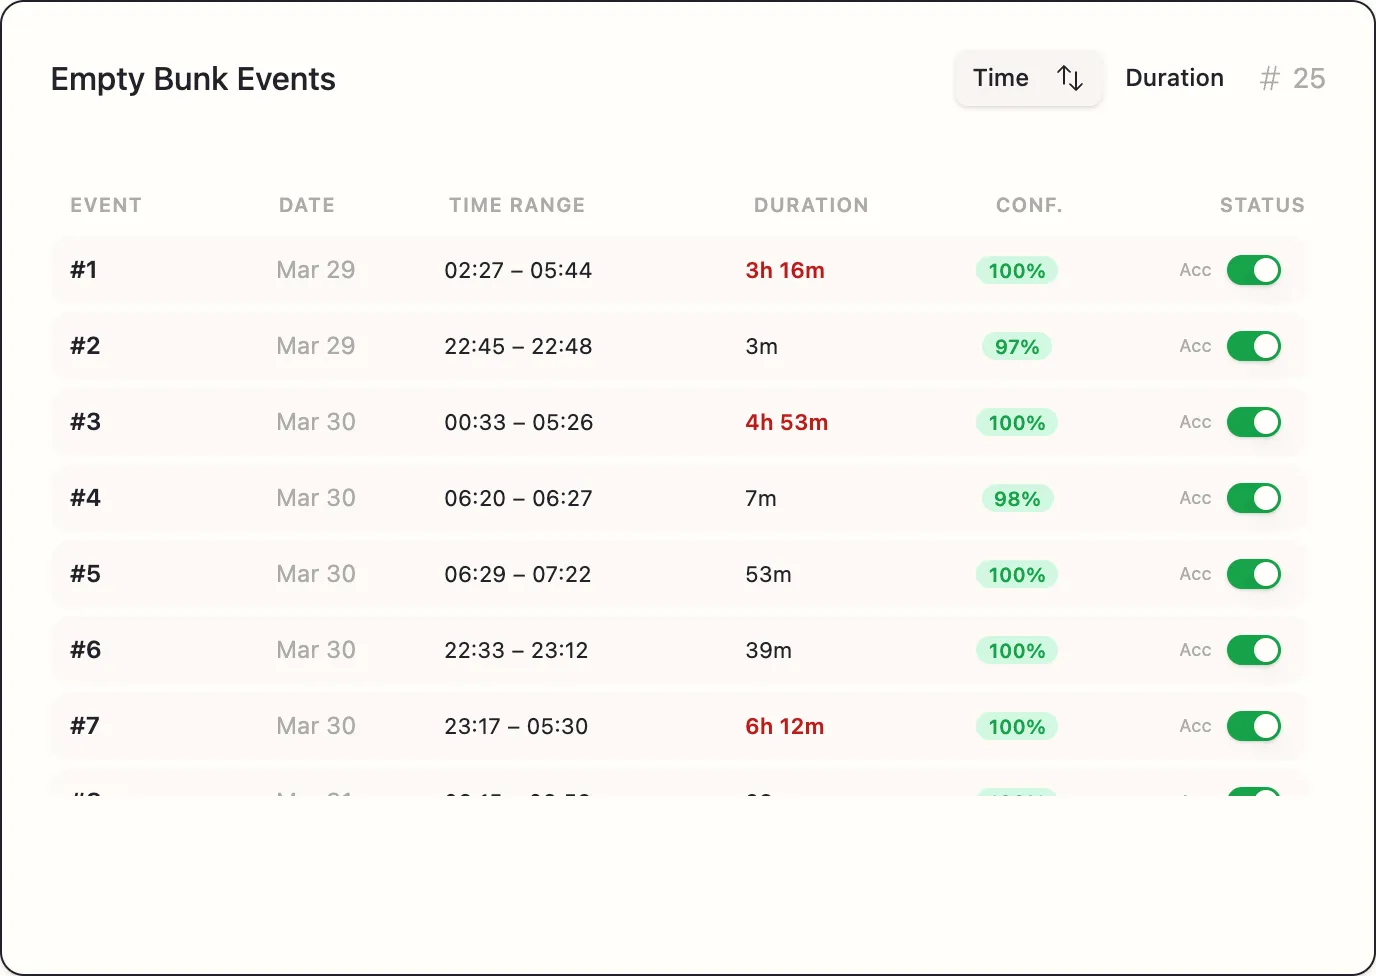
Every stretch the bunk was empty. Columns: Event · Date · Time Range · Duration · Conf. · Status.
Sort by Time or Duration using the buttons at the top. Sorting by duration puts your worst stretches first, which is usually where you want to start.
Anything over two hours is shown in red.
Vehicle Activity Events
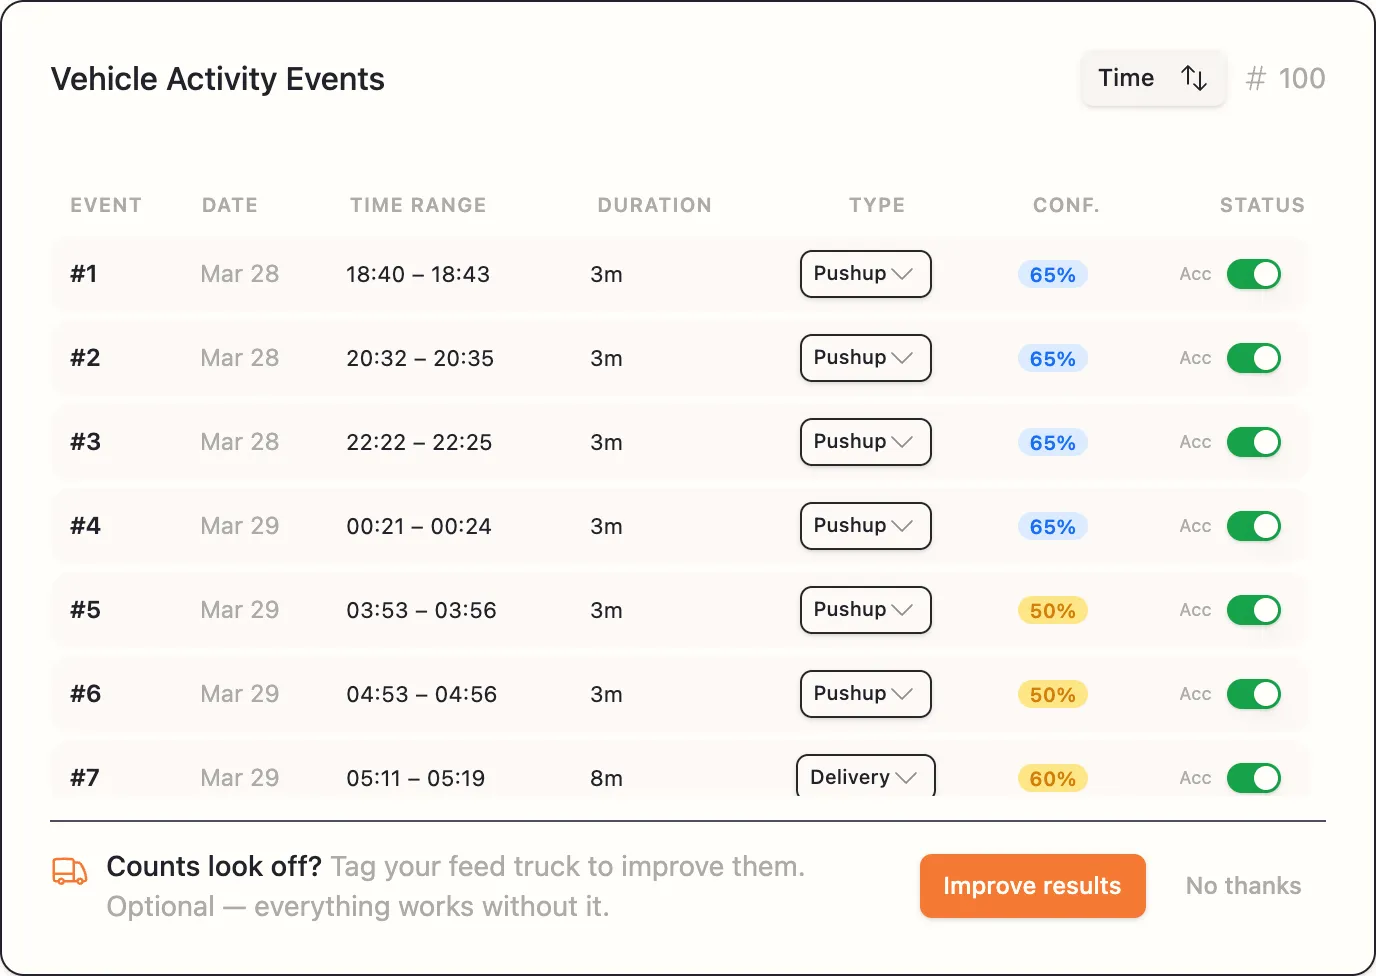
Deliveries, push-ups, and clean-outs together, in time order. Columns: Event · Date · Time Range · Duration · Type · Conf. · Status.
The Type cell is a dropdown, not just a label — you can change it. See Re-tag a delivery, push-up, or clean-out.
Confidence
Each row carries a confidence figure, like 92%. It is how sure the system is about that particular call.
Use it to prioritise, not to judge. A low-confidence event is worth clicking into and checking; it is not automatically wrong. A high-confidence event is not automatically right either — a machine that consistently looks like a feed truck but is not will be confidently mislabelled every time, and that is exactly what vehicle tagging fixes.
Accept and reject
Each row has an Acc / Rej toggle. Rejecting an event excludes it from every calculation on the report. See Accept or reject an event.
Rejected rows fade out and cannot be clicked.
Looking at the photos
Click any row and a preview opens below the lists, headed with the event and its time — Feed Delivery - Event #3, Mon 7/7 (06:10 - 06:24).
You get a strip of thumbnails. The five frames before the event started are tinted blue and labelled Before (-5), then the event’s own frames follow, each with its timestamp.
Those “before” frames are the most useful part. They show you the bunk immediately before whatever happened, which is how you tell a real delivery from a tractor merely driving past.
Click any thumbnail for a full-size view with Previous and Next buttons and a counter — Image 3 of 42.
A five-minute check worth doing
On your first report:
- Sort Empty Bunk Events by Duration and open the longest one. Does the bunk actually look empty in those photos?
- Open two or three Deliveries. Is that your feed truck?
- Open two or three Pushups. Is that a push-up, or something else driving past?
If all three look right, trust the report. If deliveries or push-ups are being confused with other traffic, tag your vehicles — it takes a minute and fixes the whole batch.
After correcting anything
Rejecting or re-tagging events makes the summary numbers stale, and a card appears at the bottom right: Statistics outdated / Refresh to update calculations. Click Refresh and everything recalculates.
Empty and error states
- No events to display — nothing in this list. If both lists are empty, see the no-events notice explained in What’s on your report.
- Loading images… then Error loading images. Please try again. — usually a temporary hiccup; try again.
- No images available for this event. — the underlying photos could not be retrieved. Worth reporting to support if it happens repeatedly.