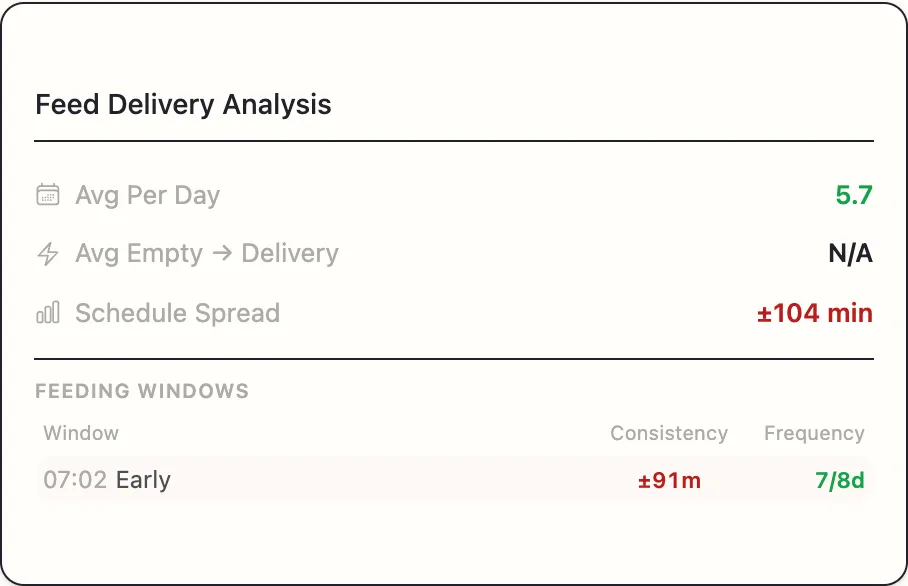
This card is about how often feed arrives and how predictably.
Avg Per Day
Average feed deliveries per day.
| Colour | Value |
|---|---|
| Green | 2 or more |
| Amber | 1 to 2 |
| Red | Under 1 |
Twice a day is the benchmark because the research is clear: dairies feeding twice daily rather than once see about 4.4 lbs more milk per day and 3.1 lbs more dry matter intake. More frequent delivery keeps feed fresher and reduces sorting.
If this reads below what you actually do, before you go any further, check the Vehicle Activity Events list and consider tagging your feed vehicles. Under-counted deliveries are the most common accuracy complaint and usually the easiest to fix.
Avg Empty → Delivery
Average time between the bunk going empty and the next delivery arriving. N/A if the bunk never went empty.
| Colour | Value |
|---|---|
| Green | Under 1 hour |
| Amber | 1 to 3 hours |
| Red | Over 3 hours |
This measures responsiveness rather than schedule. A short time here means that when feed does run out, somebody notices and deals with it. A long time means the bunk empties and then sits.
Read it alongside Longest Stretch on the empty-bunk card. Both long means feed regularly runs out well before the next scheduled delivery, and the answer is usually more feed or an earlier delivery, not a faster response.
Schedule Spread
How tightly your delivery times hold from day to day, shown as ±22 min. It is the standard deviation of the time of day your deliveries land.
This row only appears when there are at least three deliveries to measure.
| Colour | Value |
|---|---|
| Green | 30 minutes or less |
| Amber | 30 to 60 minutes |
| Red | Over 60 minutes |
Consistency matters on its own account. Cows anticipate feeding and their intake patterns adjust to a predictable schedule; a routine that wanders by an hour or more disrupts that, independently of whether the total amount of feed is right.
This is also the number most likely to surprise you. Most people feel more consistent than the clock says they are.
Feeding Windows
Below the numbers is a small table with three columns:
| Window | Consistency | Frequency |
|---|---|---|
| 06:10 Morning | ±12m | 6/7d |
- Window — the time of day this feeding usually lands, with a label.
- Consistency — how much it varies around that time.
- Frequency — how many of the recorded days actually had this feeding.
Frequency is colour-coded too: green if it happened on at least 85% of days, amber down to 60%, red below that.
A window showing 4/7d is telling you that a feeding you think of as daily only happened four days out of seven. Sometimes that is a detection problem — check the events. Often it is real, and it is exactly the sort of thing that is invisible without a camera watching every day.
Reading the card as a whole
- 2+ per day, tight spread, high frequency — a well-run routine.
- Good average, wide spread — the feed arrives, but the timing wanders. Worth tightening; it costs nothing but discipline.
- Good average, one window at low frequency — a specific feeding gets skipped. Find out which day and why.
- Below 2 per day — either genuinely feeding once a day, or deliveries are being missed by the detection. Check the events before concluding anything.